It all started with an e-mail from a co-worker on a recent Saturday afternoon, shortly after we finished performing Windows updates on all of our servers. It read something like this:
“Syslog server’s C: drive ran out of space so I created an additional drive with 20GB of space and moved all of the logs to it.”
Now I’ve only been with this new company for 4 months now, but one of the first things I did when I began learning the network was to take a look at our syslog server to see how it was configured and for baselining how many logs in an hour and day were normal for our network. So when I saw that the drive ran out of space with the amount of syslogs normally generated per day, it immediately raised an alarm.
First thing I did was verify that the original syslog drive was truly out of space and it was. What I found was unusual. Shortly after we completed Windows updates, the syslog server started receiving logs at an abnormally high rate. I’m talking going from an average of ~2,000 logs/hr to ~19,000 logs/hr. So the next thing I did was take a look at the logs to see exactly what was triggering this large influx of logs. I found 3 different source IPs in the logs that kept appearing with the same type of syslog and from the same device, our firewall:
Each source and destination IP address pair was unique and so was the destination port. One was destined for TCP port 17777, another to TCP/UDP port 161, and the last to TCP port 6711. Both the source and destination IP address in each IP address pair were private IP addresses with the source IP address being a valid IP address on our network and the destination IP addresses being invalid on our network; the destination networks did not exist. Because both the source and destination IPs were private, we immediately felt like this wasn’t a spoofing attack or something else much more malicious. However, we still could not explain why the traffic was occurring. So we took a methodical approach to figuring out exactly that.
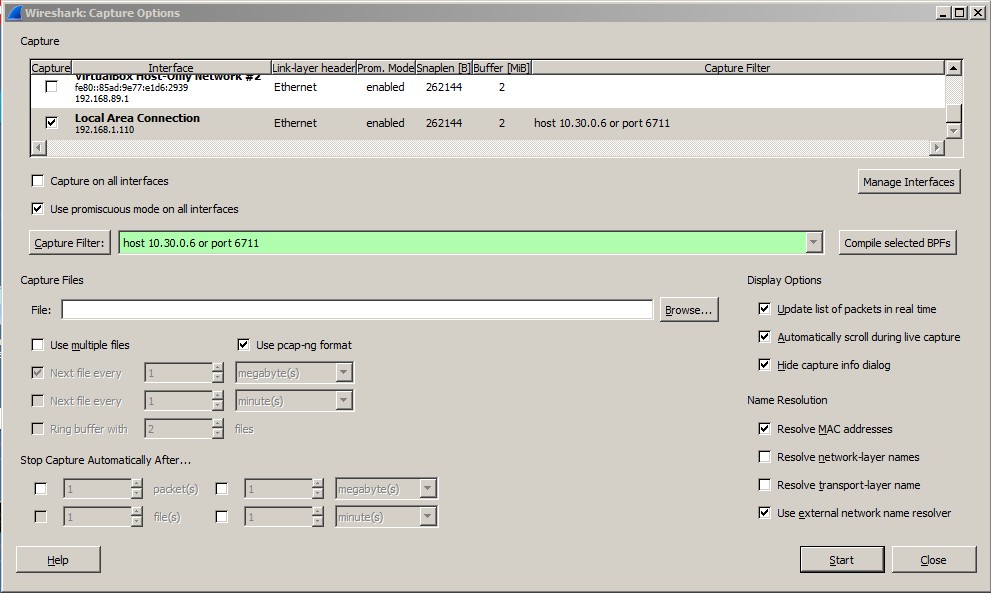
First step was to confirm that the traffic was actually occurring. We don’t have a huge network or a lot of the cool tools out there to capture traffic so we did it the “old school” way by installing Wireshark on the 3 servers. We knew the destination IPs and the destination ports so setting up a capture filter for that criteria made sense to avoid capturing everything and eventually running into disk space or memory issues. On 2 of the 3 servers, we were able to confirm this pretty quickly. On the last server, the server appeared to only generate traffic during sporadic times.
The next step was figuring out what was causing these different sets of traffic on all 3 servers. Wireshark confirmed that it was happening, but that’s where the help ended. Next came a familiar tool, netstat. By using netstat, we could determine which process or service was the cause. This worked fantastically for the first 2 servers because the traffic was more continuous, however, how was I supposed to figure out what process was being used if I wasn’t available to run the command when the traffic was actually occurring on the 3rd server?
If you read the netstat help for the command, it tells you exactly how to do this:
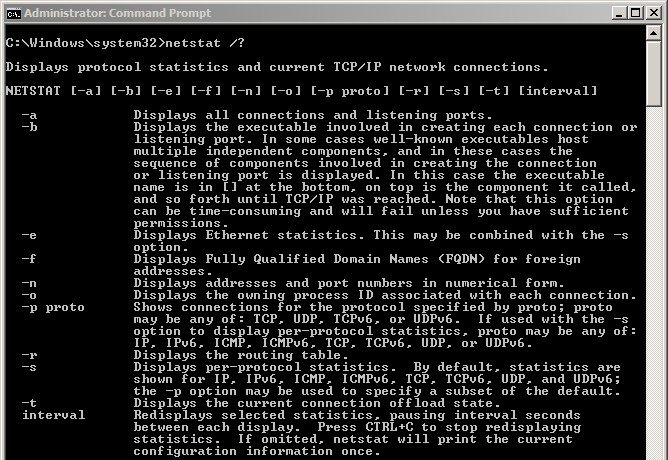
I decided to run the netstat command while refreshing it every 10 seconds and redirect it to a text file using the below command. *NOTE*: You will need to run cmd prompt as an administrator to use the -b switch
netstat -abn 10 > %userprofile%\Desktop\filename.txt
After a few hours, I was eventually able to get a hit by searching the text file for the destination port and found the offending process. After a little more research, we were able to determine the exact cause; an old device on an old, non-existent network that was configured in our Track It! server’s inventory and being scanned (or attempting to) for auditing purposes. 1 check box turned auditing off for that particular device and the associated traffic ceased. For those still with me and curious, the other 2 servers ended up being an old database remnant in our SolarWinds NPM server that had to be cleared by running some commands against the database and Cisco DCNM software installed on our AAA server that was trying to reach out to some old IP address via SNMP. With all that being said, the traffic was probably always happening, however, a combination of new code installed on our ASA the Tuesday before and the restarting of the servers after performing Windows updates probably triggered this barrage of traffic.
This was an interesting case and I definitely learned a few things about our network and the tools that I’ve been using for a few years now. In the end, I was just relieved to know that it wasn’t something more malicious, but pleased that I was able to utilize my skill set to track down the origin.